Predicting the Internal Corrosion Rate of a Free Water Knockout VesselIn Support of the Integrity Programs of a SAGD Facility
1 IntroductionHydrocarbon energy producers and operators are required to have overall inspection and integrity plans for pressure vessels and tanks. However, instances arise where knowledge of the vessel’s integrity (internally) is needed but an internal inspection is impractical or deferred to a later date, for example, to align with a shut-down. In some cases, the next scheduled internal inspection is years ahead, but actions were taken recently that affect the vessel’s integrity, such as the injection of a new chemical into the production media. Furthermore, sometimes corrosion mitigation methods designed for vessel were not implemented or not installed correctly. Documentation must be provided to support the continued operation of the vessel until the next scheduled inspection. This article presents a case where the integrity of a free water knock-out vessel (Figure 1)
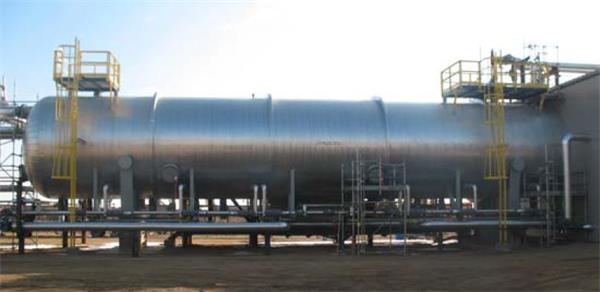
at the inlet treating area of a Steam-Assisted Gravity Drainage (SAGD) facility was evaluated through corrosion modelling in-lieu of an internal inspection.
2 ScopeThe scope of work entailed detailing the potential changes to material degradation mechanisms based on recent injection of demulsifier chemicals. Also, the identification of degradation mechanism severity with and without corrosion mitigation (cathodic protection, CP) needed quantification using relevant corrosion models and mixed potential theory, respectively.
3 Design, Construction, and Operation3.1 Design and Construction The vessel was built in 2007 from SA516-70N material for the shell and heads alike. The nominal thickness throughout was 0.875 in. with a corrosion allowance of 0.125 in. The vessel’s outer diameter was 180 in. and spanned 80 ft. in length from weld seam to weld seam. Its maximum allowable pressure and
temperature were 1,034 kPa and 200°C, respectively. The vessel was designed and manufactured for sour service, including 100% radiography of all welds.
3.2 Operating Conditions
The maximum operating pressure and temperature of the vessel were 880 kPa and 130°C, respectively. It handles an oil emulsion media consisting of liquid hydrocarbons, gas (76% methane with 12.1 mol% CO
2 and 0.25 mol% H
2S), and water of relatively low ionic content (TDS ~1300 ppm including chlorides) and a near-neutral pH of 7.25.
3.3 Corrosion Control
The operator indicated that corrosion inhibitors may be carried into the vessel from upstream production. Residuals are unknown, hence are treated as negligible here. A CP system is installed in the vessel consisting of aluminum anode rods at eight locations, each 3 inches in diameter and 22 inches in length. An example anode is seen as the bright
rod in Figure 2.
 4 Injection Chemicals and Their Effects
4.1 Injected Process Chemicals
As per the operator, a chemical demulsifier and reverse demulsifier were injected into the vessel starting in mid-2018. The specific chemical mixtures are proprietary. They are referred to as Chemical {1} and {2} herein.
1. Chemical {1}: For dehydration treatment of crude oil emulsions. Has a pH of 6.5-9.0 and a decomposition temperature of 385◦C.
2. Chemical {2}: For pre-treatment of SAGD high-temperature production fluid. Also has a pH of 6.5-9.0 but a lower decomposition temperature of 180◦C. Contains poly dimethyl diallyl ammonium chloride.
4.2 Effects of Injected Process Chemicals
The influences for the injected process chemicals {1} and {2} were as follows detailed:
a. Enhanced separation (demulsifying) of water and gas phases from the oil emulsion, meaning more water wetting of internal bottom surfaces. However, due to gas phase separation this also means less mixing and dissolvability of acid gases therein.
b. Digression of the free water pH to acidic levels is unlikely, due to the near-neutral range of both chemicals being injected in water initially around neutral pH. Also, the ratio of injected chemicals to production media is very small, hence not expected to change the pH noticeably.
c. Chemical {2} may introduce salts in critical separated free water phase, depending on operating factors such as mixing, temperature, pressure, etc. Hence, conservative values for water chemistry (e.g., max chloride content possible) is used in the corrosion modelling.
d. The decomposition temperatures of Chemicals {1} and {2} are above the normal operating temperatures of the vessel. Therefore, fouling of the vessel’s internal surfaces or inlets/outlets is unlikely.
5 Corrosion Rate (CR) and Remaining Life CalculationsDue to the presence of 12.1 mol% CO
2 and a free water phase in the vessel, CO
2 corrosion is expected to be the primary form of degradation. H
2S corrosion may also play a minor role with the presence of small quantities of H
2S and the free water. CO
2 and H
2S corrosion were modelled separately, and the higher of the two corrosion rates yielded was used as the result, for conservatism.
5.1 CO
2 Corrosion
For CO2 corrosion, the corrected model of de Waards, Lotz, and Milliams [1] was used. The basis of this model is a CR from temperature (T) and the partial pressure of CO2 (pCO2) in <Equation 1> below. Correction factors were used to account for non-ideal behavior of CO2 gas (through fugacity), iron carbonate (FeCO3) scale formation, and pH change resulting from hydrolysis of corrosion products.
logV=5.8-1710/T+0.67log(p〖CO〗_2)
<Equation 1>
Using the 8.8 bar pressure, 130◦C temperature (higher than the FeCO
3 scaling temperature), 7.25 pH, and previously listed gas and liquid compositions/properties (chloride concentration in water increased by 100 ppm to account for injected chemicals), the CO
2 CR was- found to be 12.0 milli-inches per year (mpy). It is noted that this is a conservative result based on higher bound operating conditions and not considering the reduction of CR due to CP (see 5.3 below).
5.2 H
2S Corrosion
For H
2S corrosion, since the H2S concentration in the media is low, the slightly sour corrosion model from NACE Publication 21413-SG [2] was used, shown in <Equation 2> below for mpy units. This model is based on the temperature and pH-dependent rate of dissolution of iron sulfide (FeS), which when dissolved does not provide protection of the base steel. Using the applicable inputs, this model yielded a CR of 13.8 mpy, which is slightly higher than the result from the CO
2 model.
CR in mpy= e^(-9255/T)×10^(-pH)×2.302E19
<Equation 2>
5.3 Cathodic Protection Effect
It was assumed the CP system was properly designed and maintained. Using mixed potential theory, a reduction in the corrosion current density (proportional to CR) of the internal steel surface wetted by the separated water phase is expected to be at least two orders of magnitude. This can be seen visually by comparing the I'
corr (corrosion current density) of 102 μA/cm^2 to the 1 μA/cm^2 of the protected I’
corr in the generic polarization plot of Figure 3.
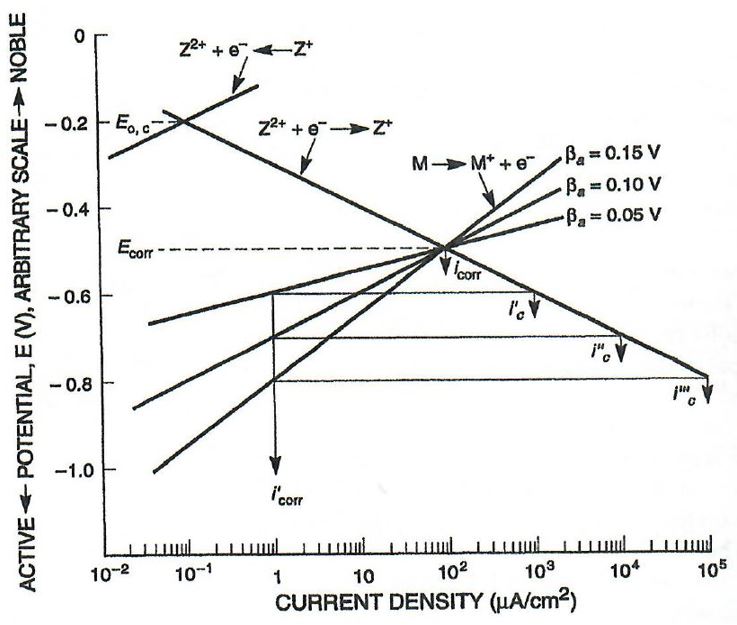
As such, in a conservative situation the CR of the vessel’s internal surface whilst protected with CP is expected to be 0.138 mpy.
5.4 Remaining Life
The most recent previous inspection results were used as the starting wall thickness for remaining life calculations. The minimum wall thickness (tmin) for structural integrity was provided be the owner as 0.438 in. It was assumed that the most conservative CR calculated above would occur linearly in the duration between the most recent previous inspection and the time of this analysis. It was found that the expected wall thickness of the vessel would be well above the tmin at the time of the analysis. The vessel could operate for 14 years before reaching tmin even if CP was not being deployed, or more than 25 years if CP is being used.
6 Summary
Injected process chemicals in the vessel under analysis enhanced separation of water and gas phases from the oil emulsion, meaning more water wetting of internal bottom surfaces. However, digression of the free water pH to acidic levels is unlikely, due to the near-neutral range of both chemicals and the very small ratio of injected chemicals to production media. The introduction of salts in the critical separated free water phase was considered in corrosion modelling, but fouling was not expected because the decomposition temperatures of the chemical are above the normal operating temperatures of the vessel. A CO2 corrosion rate of 12.0 mpy was found using an established model, compared to 13.8 mpy using the slightly sour model from NACE Publication 21413-SG. A reduction in the corrosion rate of the internal steel surface wetted by the separated water phase due to CP was estimated to be at least two orders of magnitude. The assessment indicated that the vessel is currently operating within its remaining life based on conservative degradation rates, even without protection from the internal CP system.
7 References
[1] C. de Waard, U. Lotz, D. E. Milliams, “Predictive Model for CO2 Corrosion Engineering in Wet Natural Gas Pipelines,” CORROSION 47 (12), 1991.
[2] NACE Technical Committee Report 21413-SG, “Prediction of Internal Corrosion in Oilfield Systems from System Conditions,” 2017.
_ _ _
This article was originally published in MTI CONNECT 2022, Issue 1. Download the complete article with charts and tables.